Introduction
When I use coding agents, I often need to retrieve details from a Sentry issue to provide context for diagnosing the root cause. I’ve been using the Sentry MCP for this, but I wanted to switch to a simpler command-line tool. I assumed sentry-cli would fit the bill, until I realized it’s designed for a different purpose (per their docs):
|
|
At this point I realised I needed a different CLI. I tried to search around but I couldn’t find exactly what I was looking for, so I decided to give it a shot.
What is Sentire?
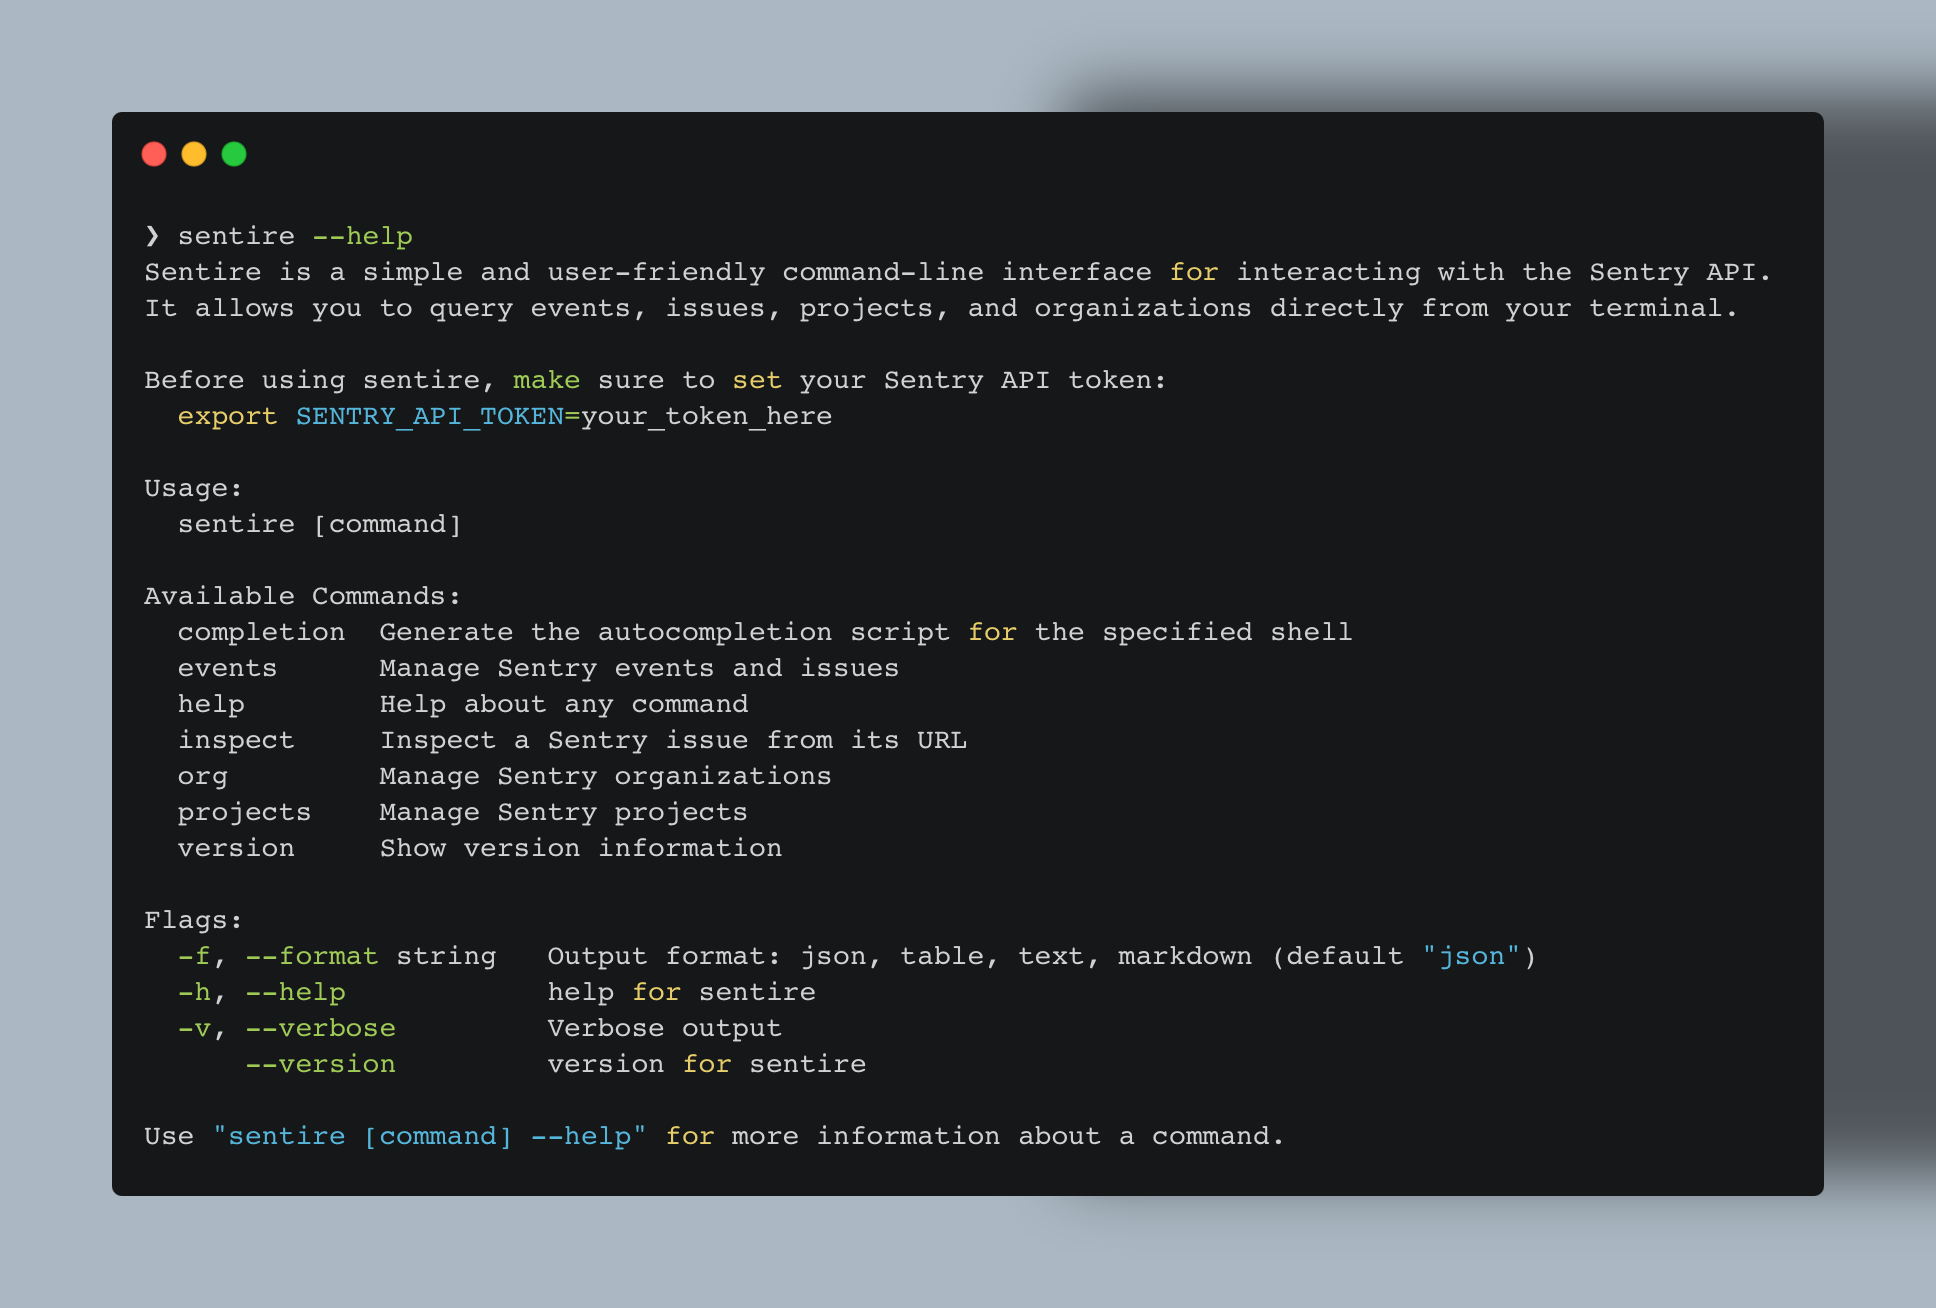
Sentire is a simple and user-friendly command line interface for the Sentry API, written in Go. The name “sentire” comes from Italian, meaning “to feel” - reflecting its purpose of helping developers feel the pulse of their application’s health through Sentry’s monitoring data.
Sentire provides an intuitive CLI for interacting with Sentry’s API, covering essential operations including managing events, issues, projects, and organizations.
Key Features
- Multiple Output Formats: JSON, table, text, and markdown formats to suit different use cases
- Comprehensive API Coverage: Essential Sentry operations for debugging workflows
- Built-in Pagination and Rate Limiting: Handles Sentry’s API constraints automatically
- Human-readable Output: Perfect for terminal usage and quick analysis
- Machine-readable JSON: Ideal for scripting and automation
- URL Inspection: Parse Sentry URLs directly to get detailed event information
Note: this CLI doesn’t implement (yet) all the Sentry API. I focussed on the commands needed to retrieve projects, issues and events. More commands will be added in future releases.
Installation
Install via Homebrew (macOS):
|
|
For other installation methods (Go install, pre-built binaries, building from source), see the official README.
Complete source code is available on GitHub: https://github.com/andreagrandi/sentire
Getting Started
First, set your Sentry API token as an environment variable:
|
|
You can obtain an API token from your Sentry organization settings under “Auth Tokens”.
Then you can start exploring your projects and issues:
|
|
Output Formats
Sentire supports multiple output formats to suit different workflows:
- JSON (default): Machine-readable format for scripting
- Table: Human-readable format with borders for terminal viewing
- Text: Clean plain text format for simple parsing
- Markdown: Documentation-friendly format for reports
|
|
URL Inspection
One of Sentire’s unique features is the ability to parse Sentry URLs directly:
|
|
This automatically extracts the organization and issue ID from the URL and fetches the most relevant debugging information.
Use Cases
Sentire is particularly useful for:
- Debugging Workflows: Quickly inspect Sentry URLs and get detailed event information without leaving the terminal
- DevOps Teams: Integrating error monitoring into deployment pipelines with machine-readable JSON output
- On-call Engineers: Using table format for quick issue triage and markdown format for incident reports
- Development Teams: Multiple output formats reduce context switching between terminal and web interface
- Automation and Scripting: Built-in rate limiting and pagination make it reliable for automated workflows
- Documentation: Markdown output format perfect for including error analysis in reports and documentation
Conclusion
Sentire brings Sentry to your terminal because, let’s be honest, who has time to click around web interfaces when bugs are breathing down your neck?
It’s open source, so if you find bugs (oh, the irony!), have feature requests, or just want to make it less terrible, feel free to open an issue or send a pull request. I hope you will enjoy it 🙂
